


Three charts in Gript answer the same underlying question — "am I training everything, or just the fun stuff?" — from different angles.
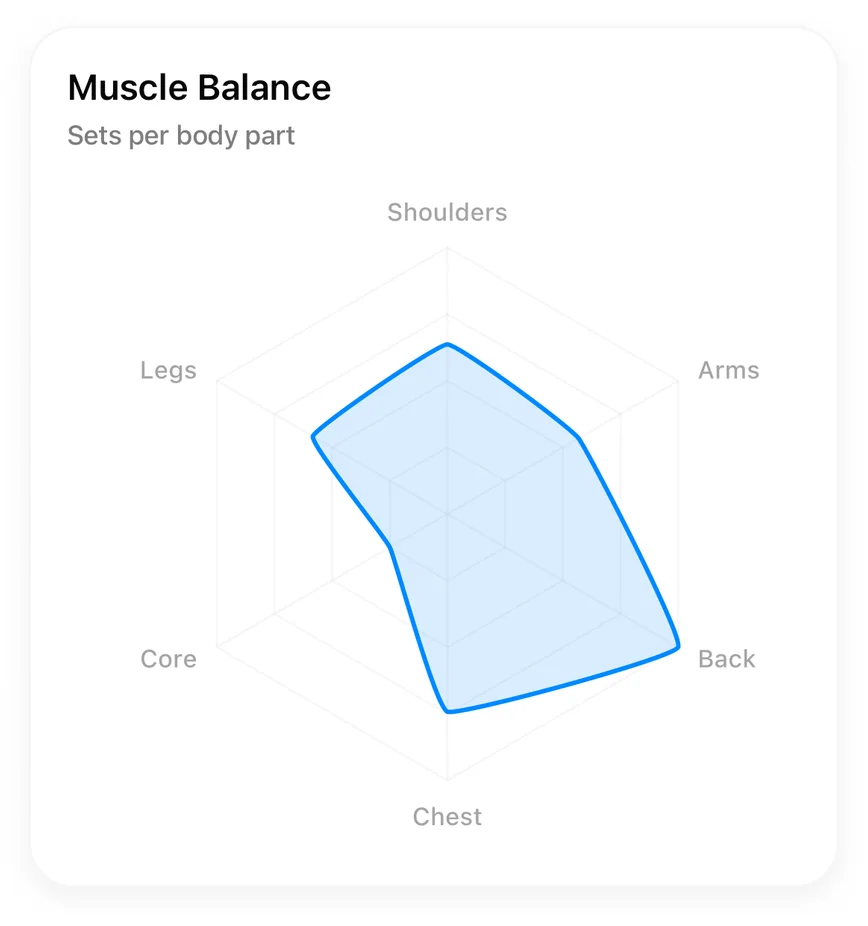
Muscle Balance (radar chart)#
A radar chart on the Performance tab that plots your training across muscle groups over the selected period. A balanced program draws a round shape; a lopsided one shows spikes (that giant chest lobe) and dents (those forgotten legs).
Muscle Split (donut chart)#
A donut chart showing the proportion of your training per muscle group. Switch the metric between Sets, Reps, and Volume — useful because 3 sets of squats and 3 sets of curls are very different amounts of work in volume terms.
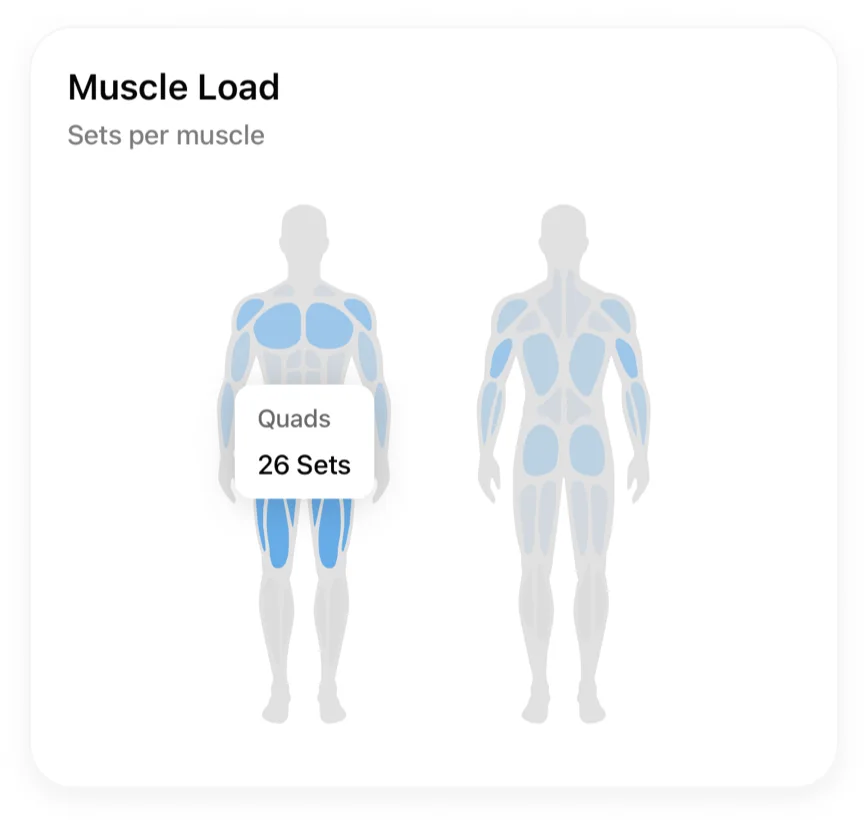
Muscle Load (body heatmap)#
A front and back silhouette where each muscle lights up in proportion to how much work it took over the selected period — the fastest way to spot what you have been neglecting. Switch the metric between Sets, Reps, and Volume like the other two. Press and hold anywhere on either silhouette and Gript highlights the muscle under your finger and shows its name with its value for the selected metric; slide around to read the rest of the body, and lift your finger to clear it. The silhouette is female if you picked Woman when you first set up Gript, and male otherwise.
How sets are attributed#
Every exercise in the library lists the muscles it works. Each primary muscle gets full credit for a set and each secondary muscle gets half, rolled up into its body part — so a deadlift counts fully toward legs and back and half toward the traps, forearms, and abs that assist. Muscle Balance, Muscle Split, Weekly Sets, and Weekly Volume by muscle group all use the same rule, so compound lifts are never counted as one-muscle work.
Reading the charts#
- Compare time periods to see whether a lagging muscle group is actually getting more attention.
- Pair Muscle Balance with the Weekly Volume chart's per-muscle-group breakdown to see not just the ratio but the absolute trend.
Muscle Balance, Muscle Split, and Muscle Load are Gript PRO charts.