

The Performance tab is a dashboard you assemble yourself: pick the charts that matter for your training, in the order you want them.
Add a chart#
- Open the Performance tab and tap Add Chart.
- Pick from three sections: Body charts track a body measurement (you will be asked which), Exercise charts track one movement (also asked which), and General charts cover your training as a whole.
Not sure what each chart shows? See all chart types explained.
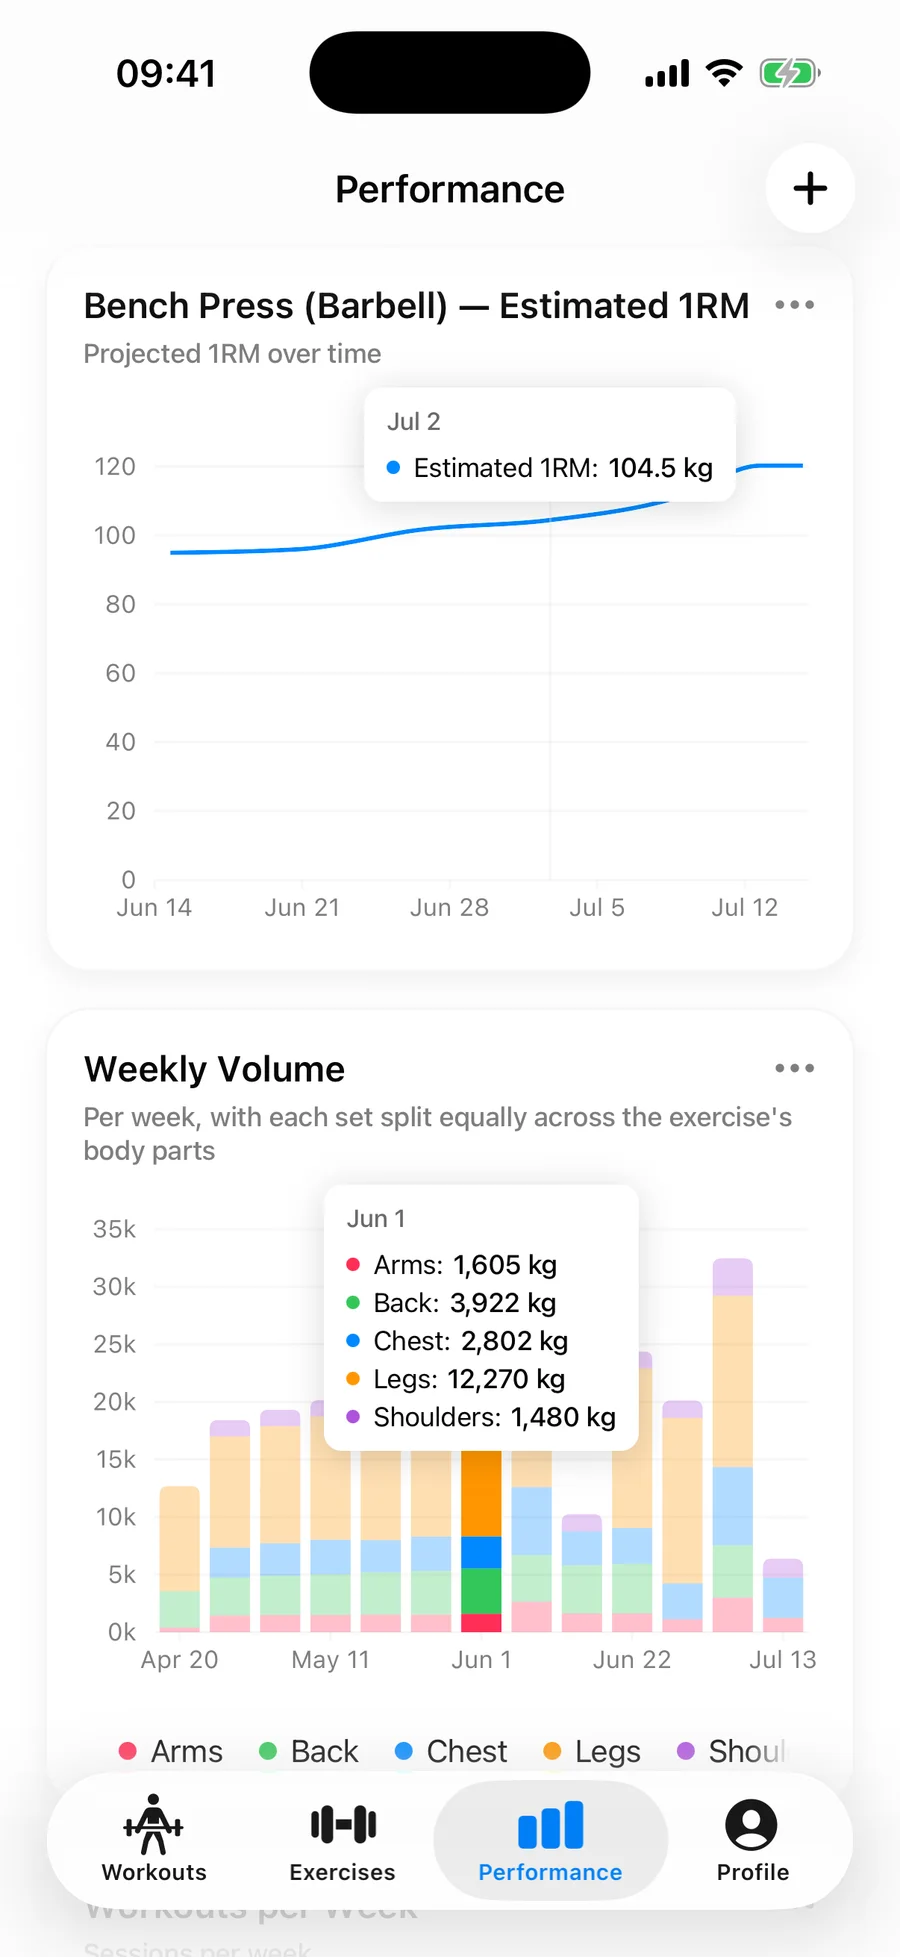
Manage your charts#
- Reorder — hold and drag a chart to move it up or down the dashboard.
- Time period — tap the chip in a chart's header (7D, 30D, 3M, 6M, 12M, All) and pick a range. Each chart keeps its own, and offers the ranges that make sense for it. 7D, 30D, and 3M are free; 6M, 12M, and All show a lock and open the upgrade screen.
- Change Exercise — swap which movement an exercise chart tracks.
- Remove — take a chart off the dashboard. Your data is untouched; add the chart back anytime.
Share a chart#
Any chart can go out as an image. Open its ••• menu and tap Share to get a Share Chart preview: a card with the chart, its exercise or measurement name, and the selected time period. The button in the top corner flips the card between a light and a dark look. Tap Stories to post it straight to Instagram Stories as a sticker, or the share button to save it or send it through the system share sheet. The same Share entry exists on the charts inside an exercise's detail view and a body measurement's detail view.